
Found 72 datasets matching "heat map".
-
In this submission is the groundwater composite risk segment (CRS) used for play fairway analysis. Also included is a heat flow probability map, and a shaded relief map of the Tularosa Basin, NM.
Search relevance: 140.01 | Views last month: 0 -
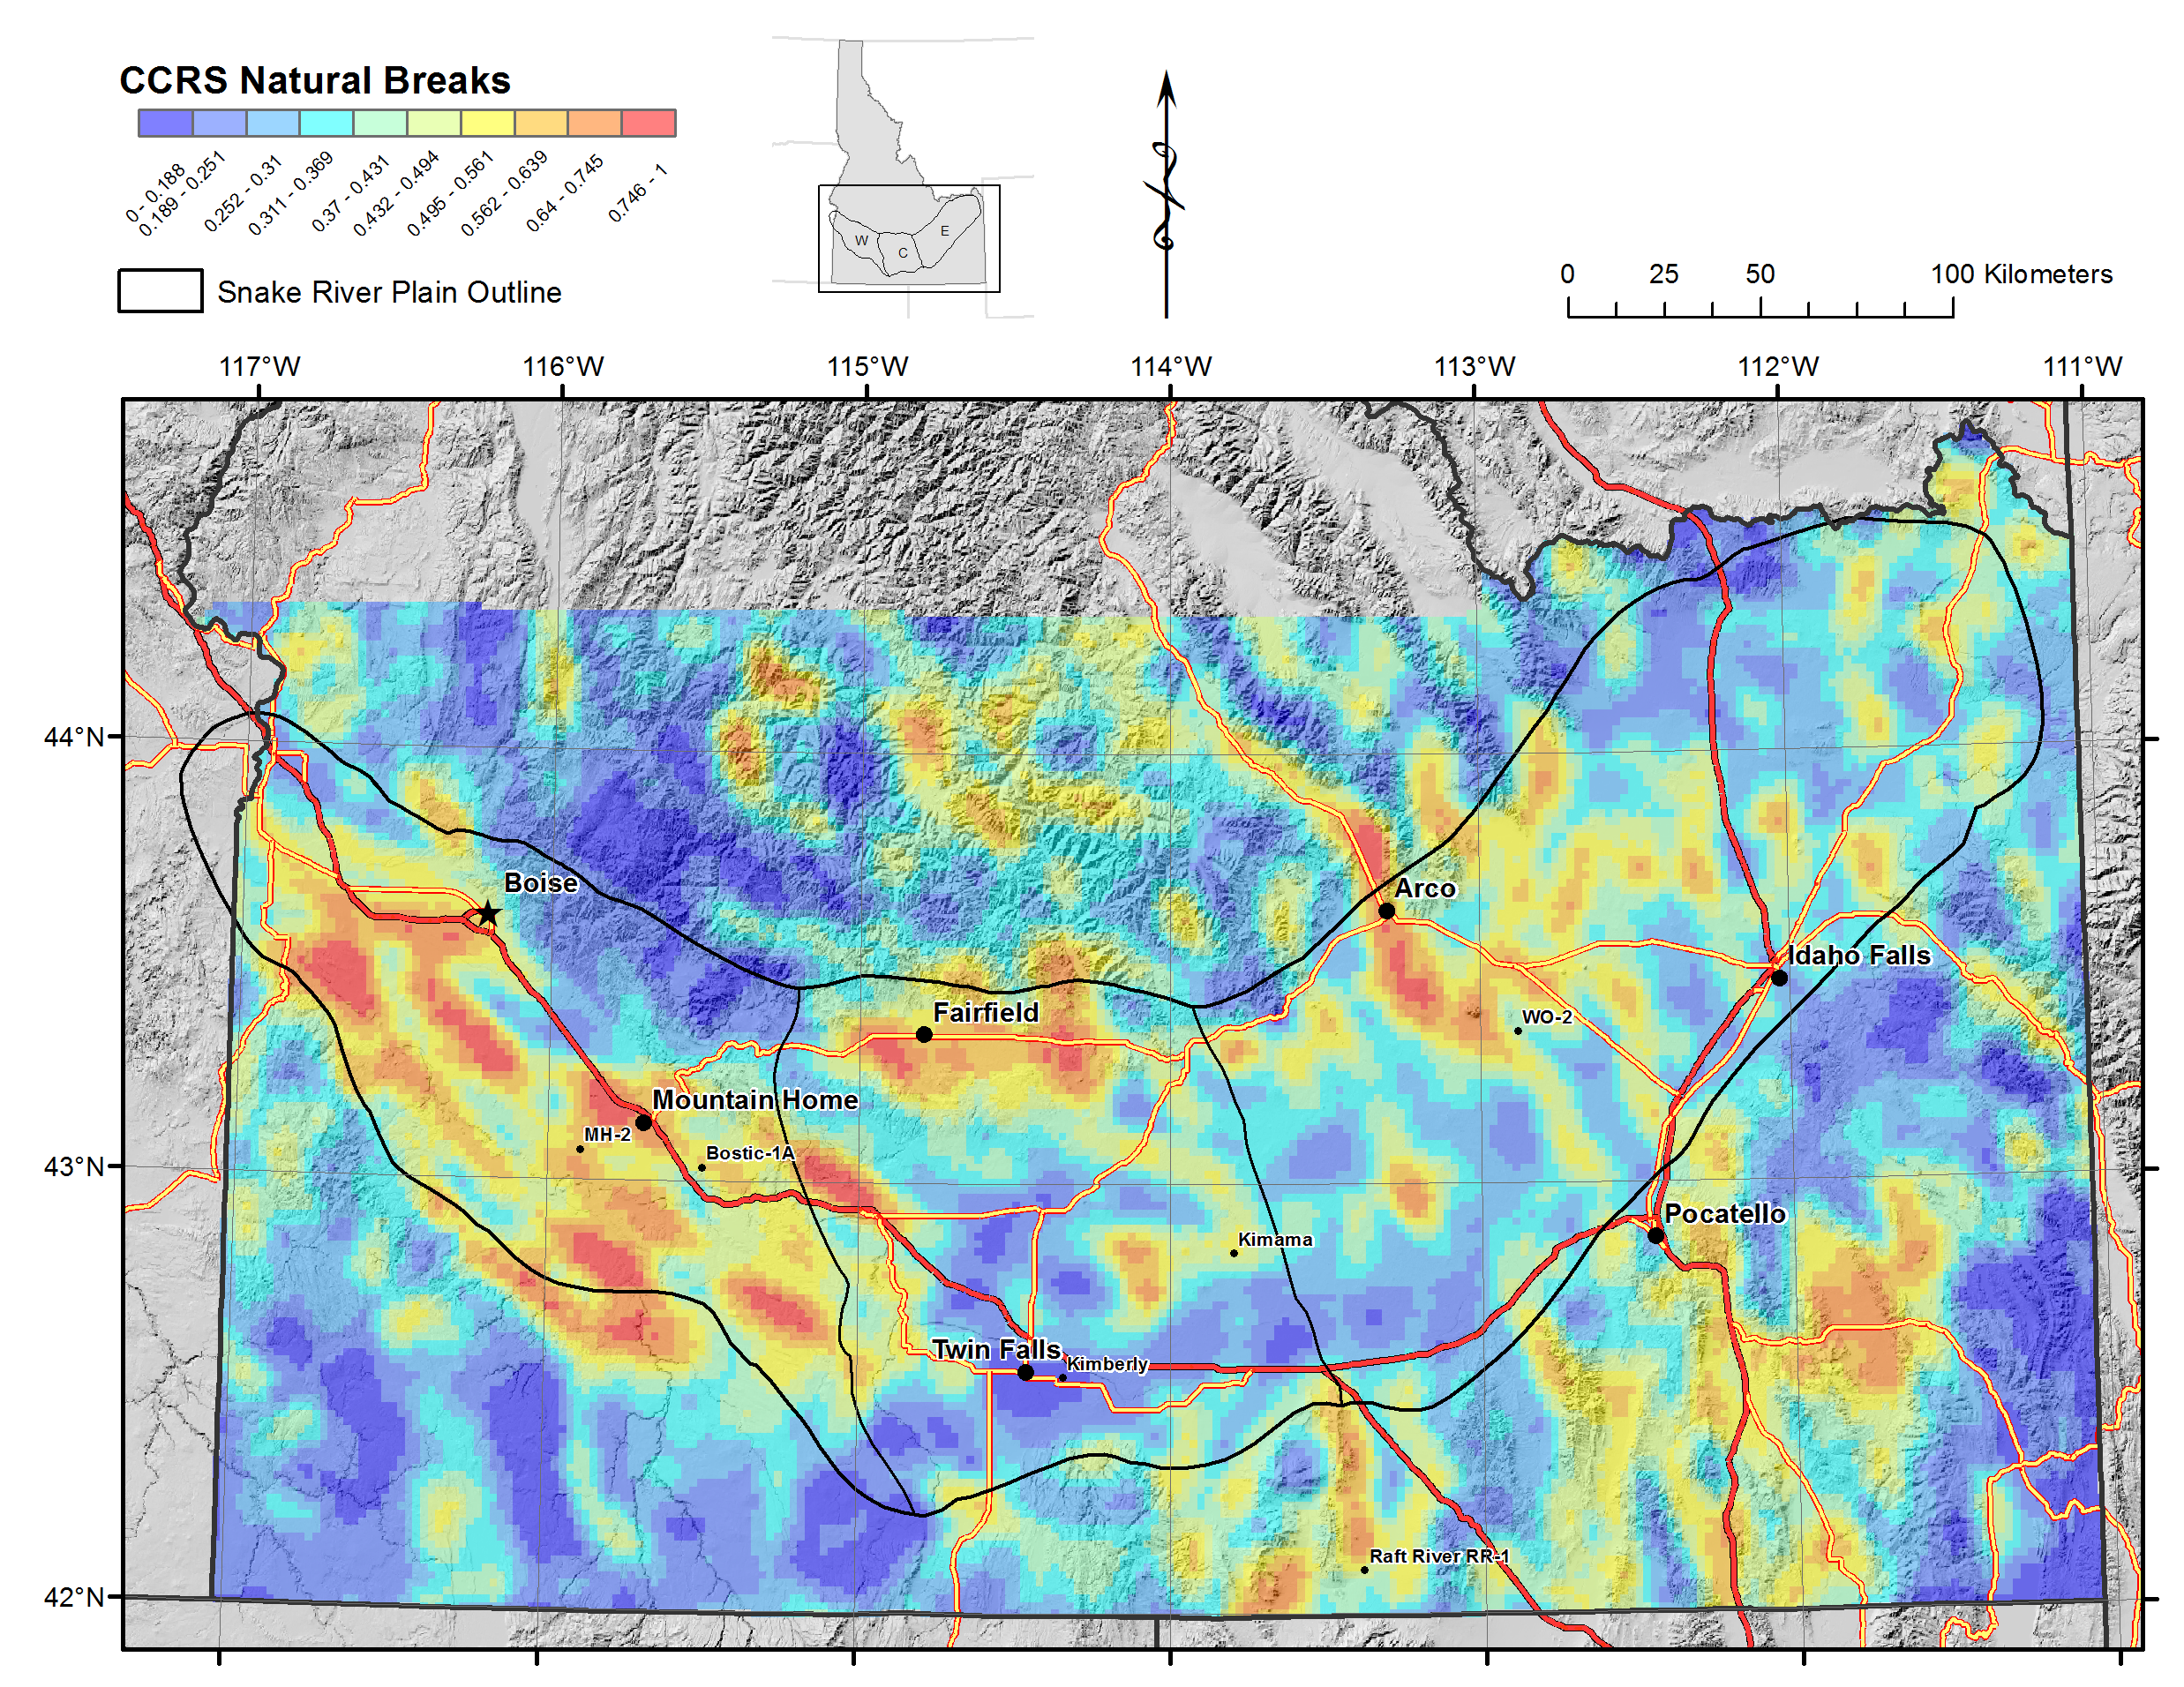
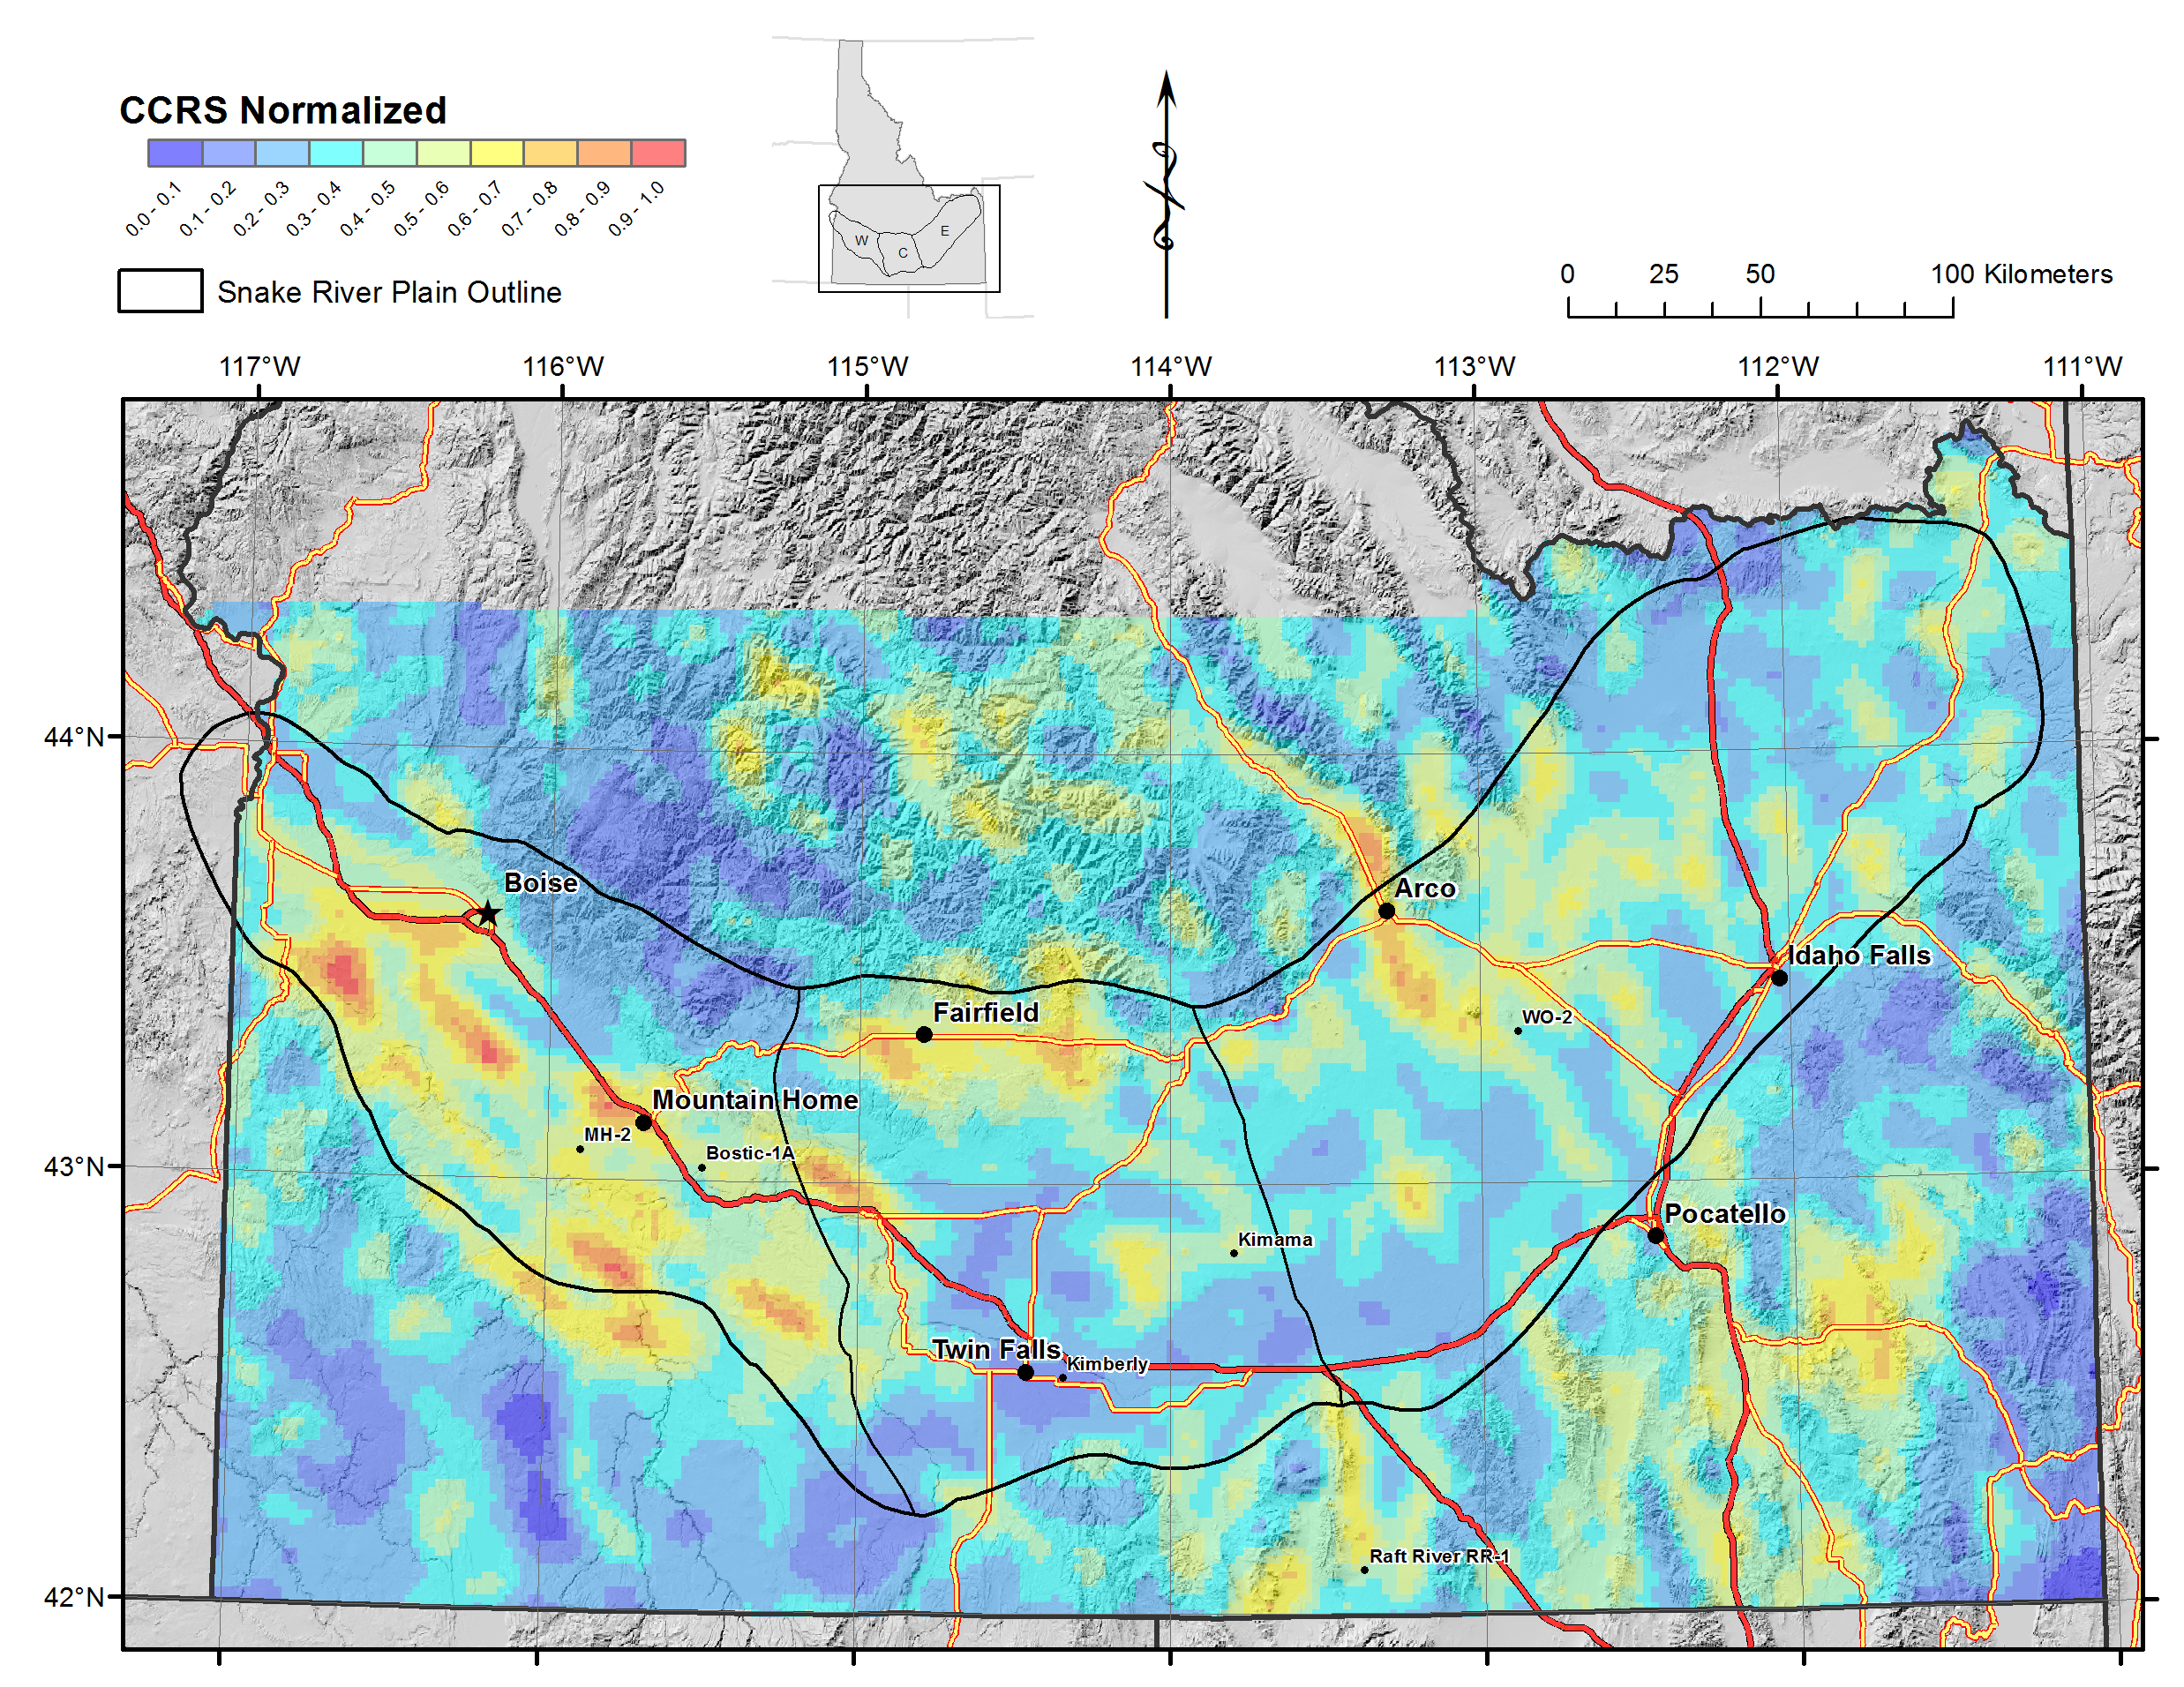
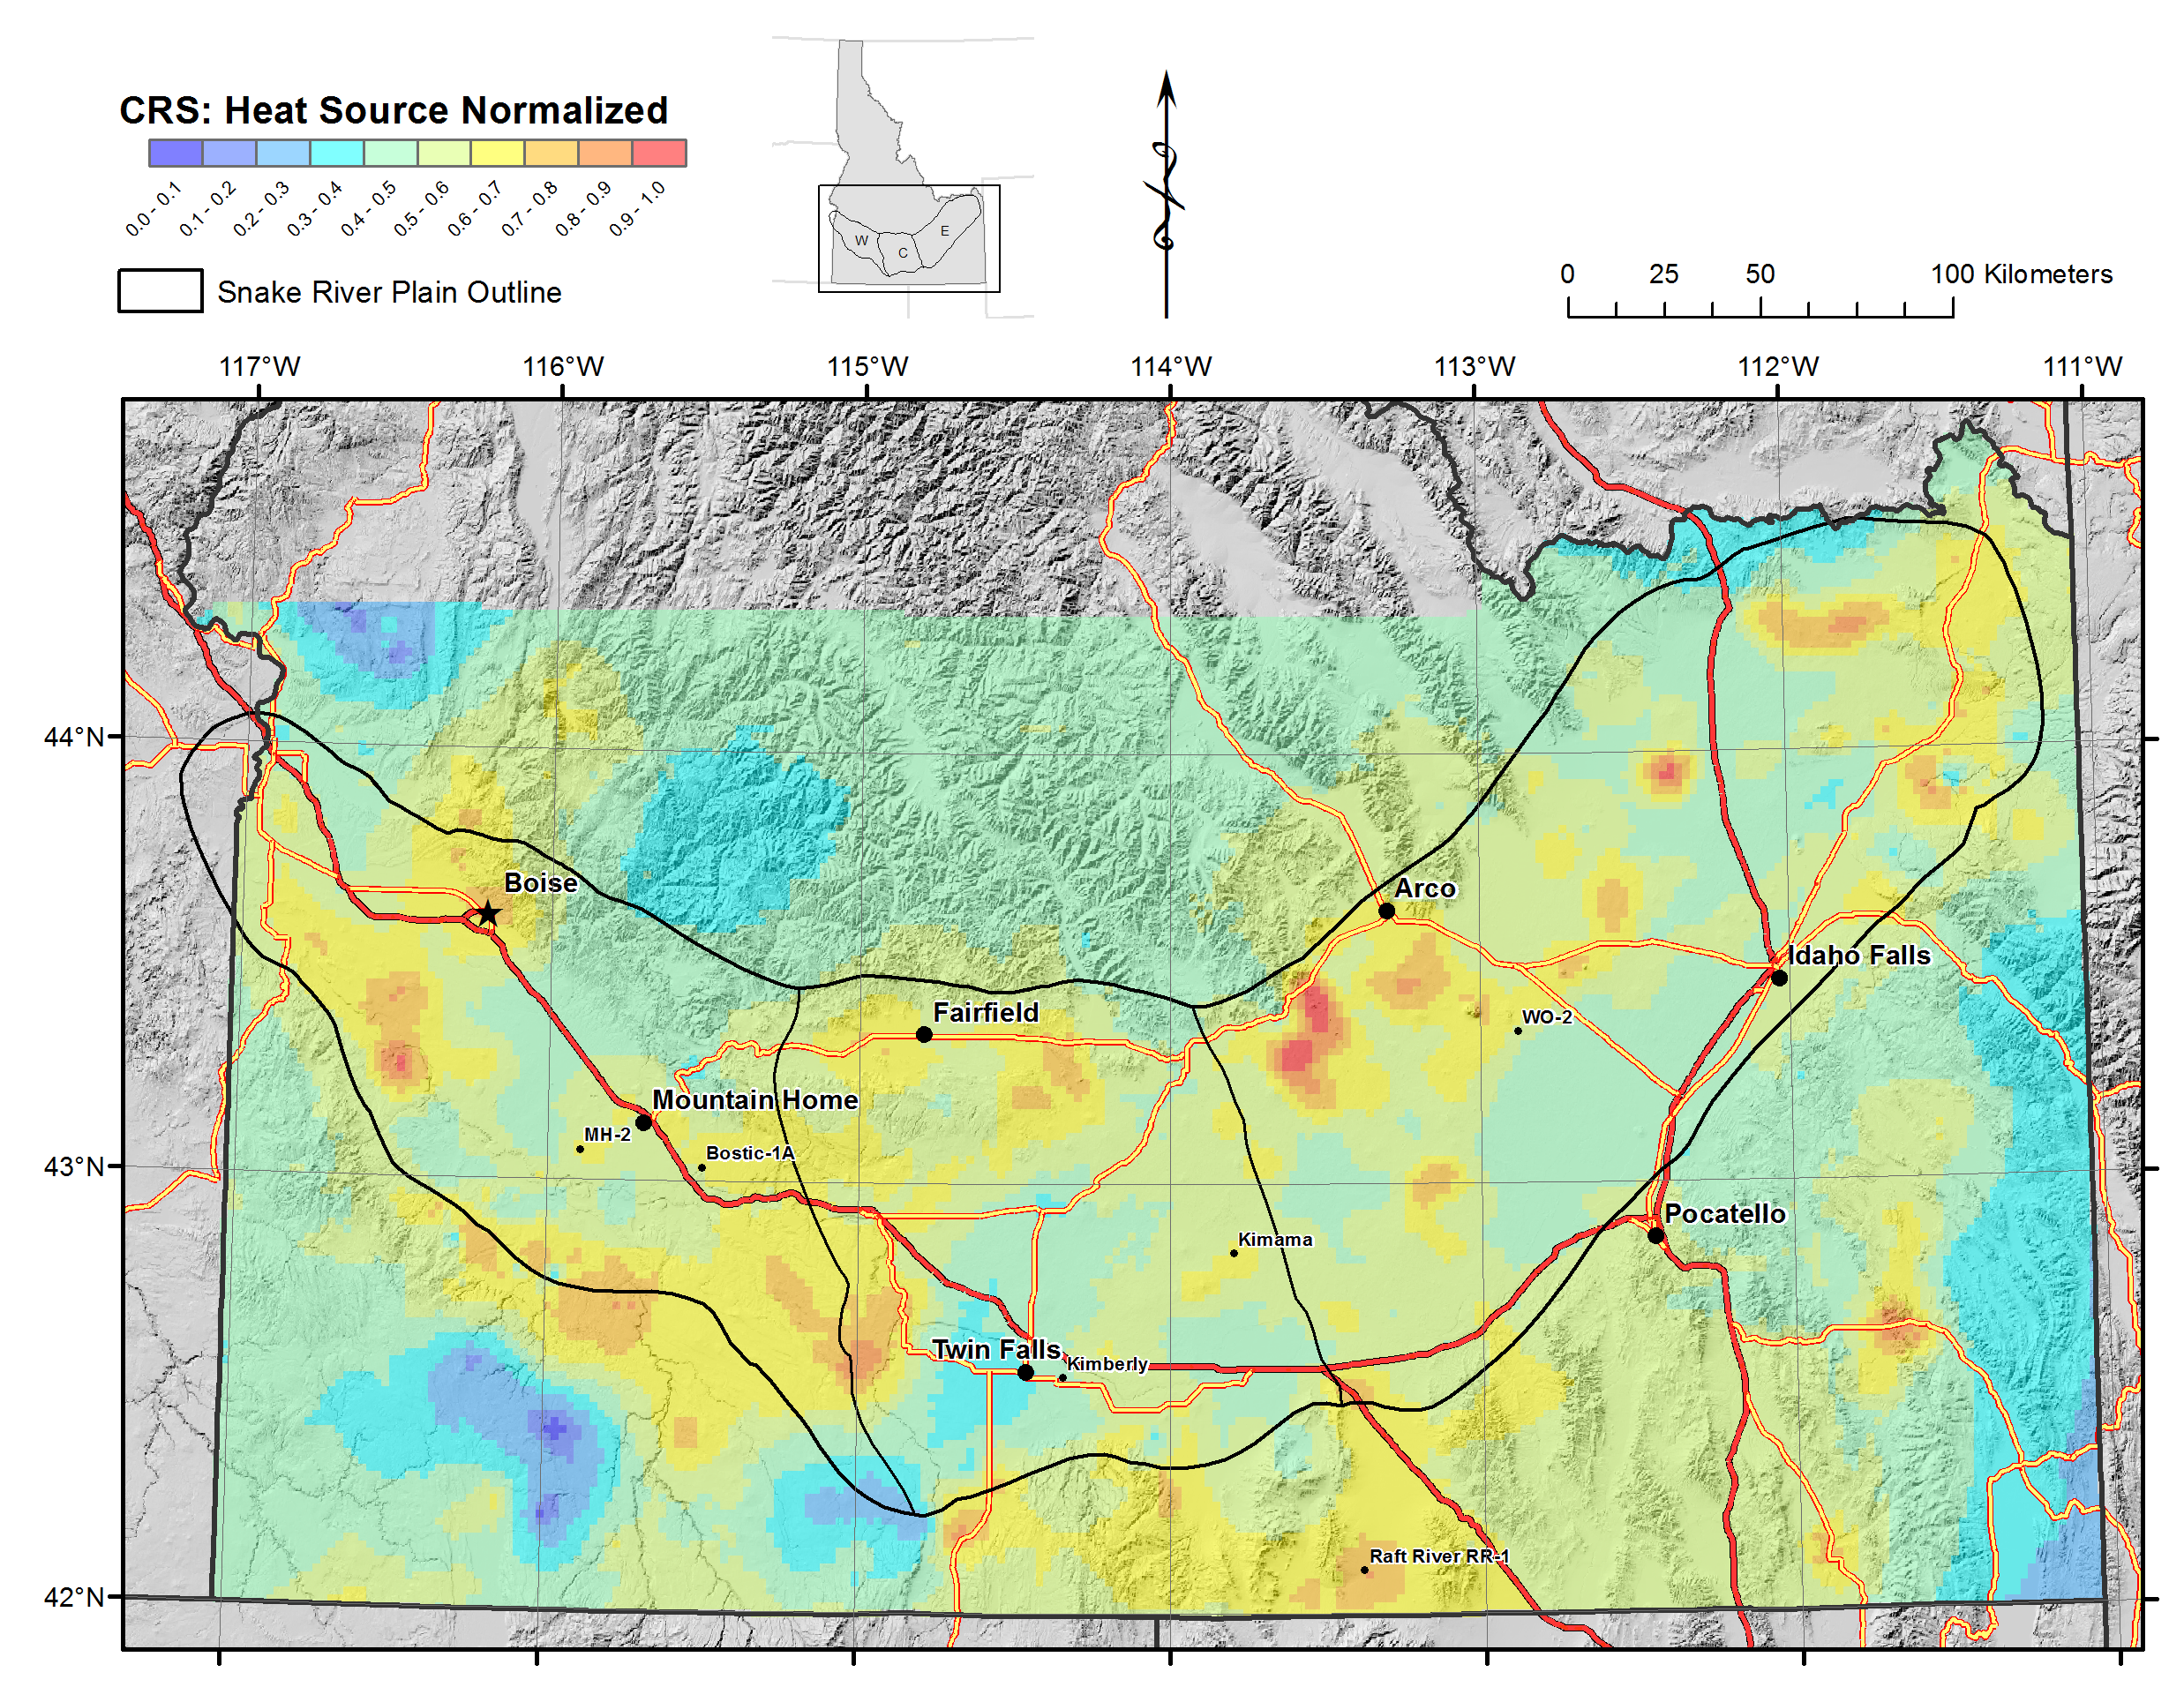
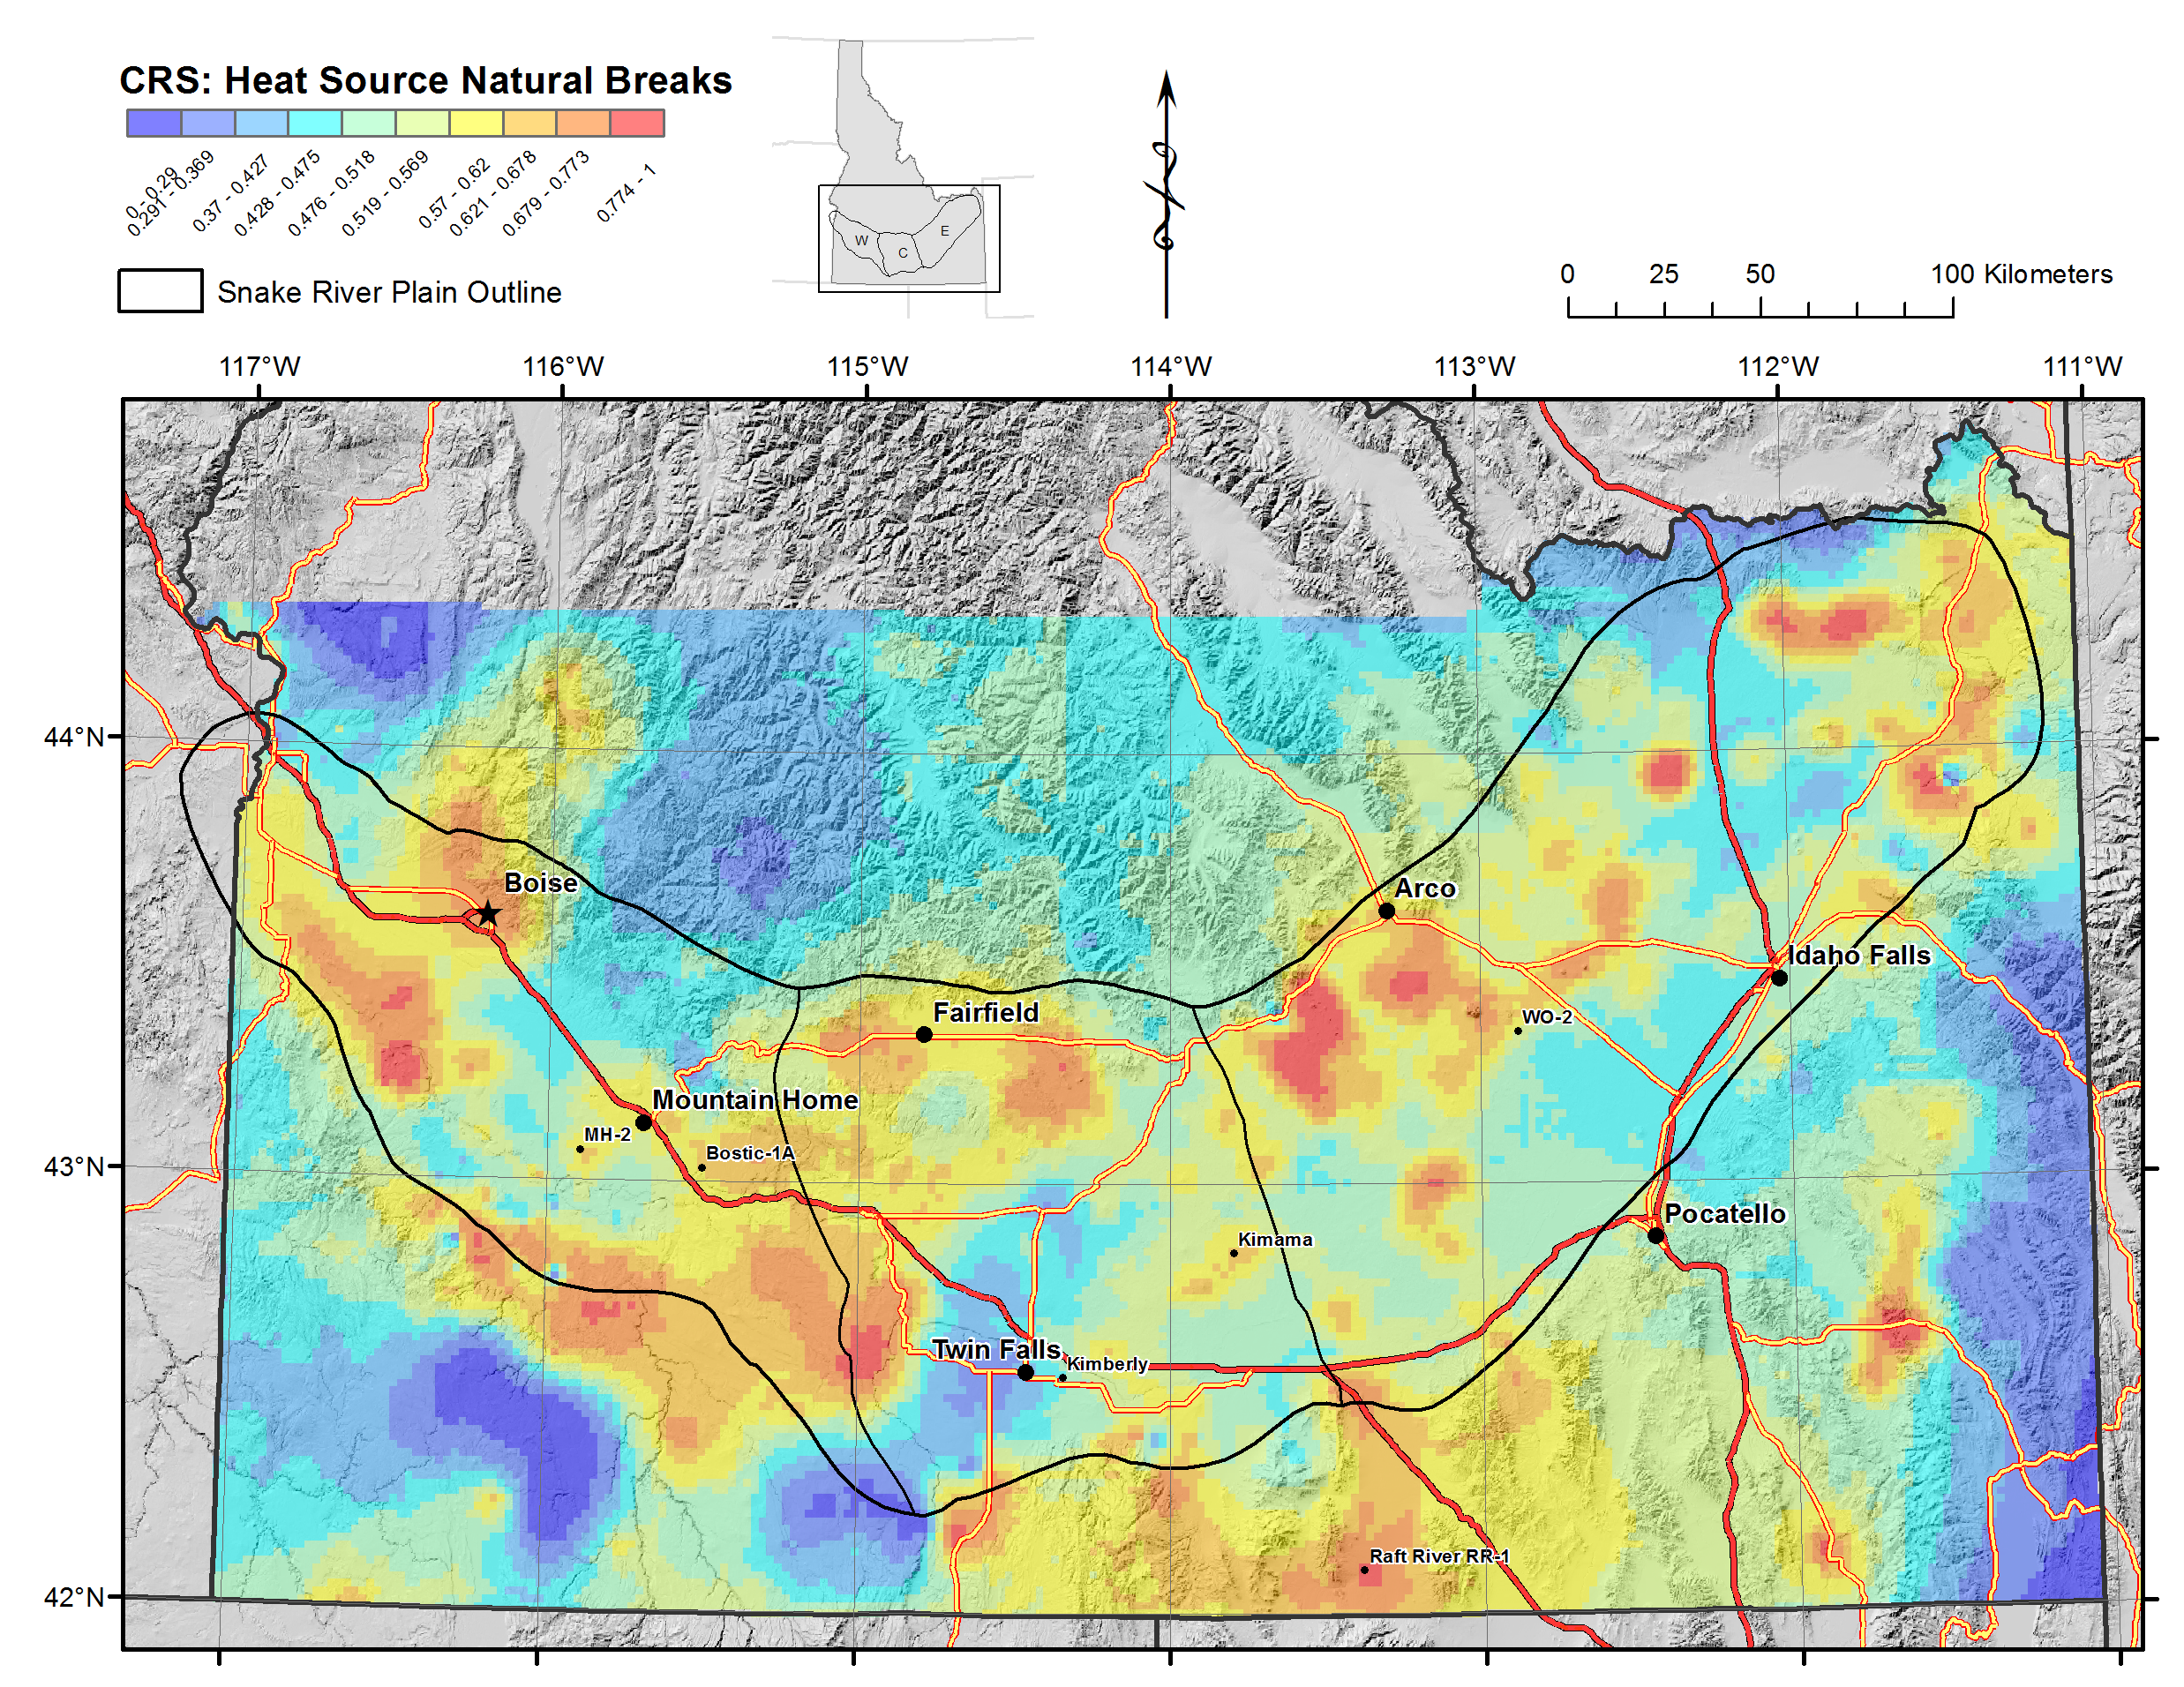
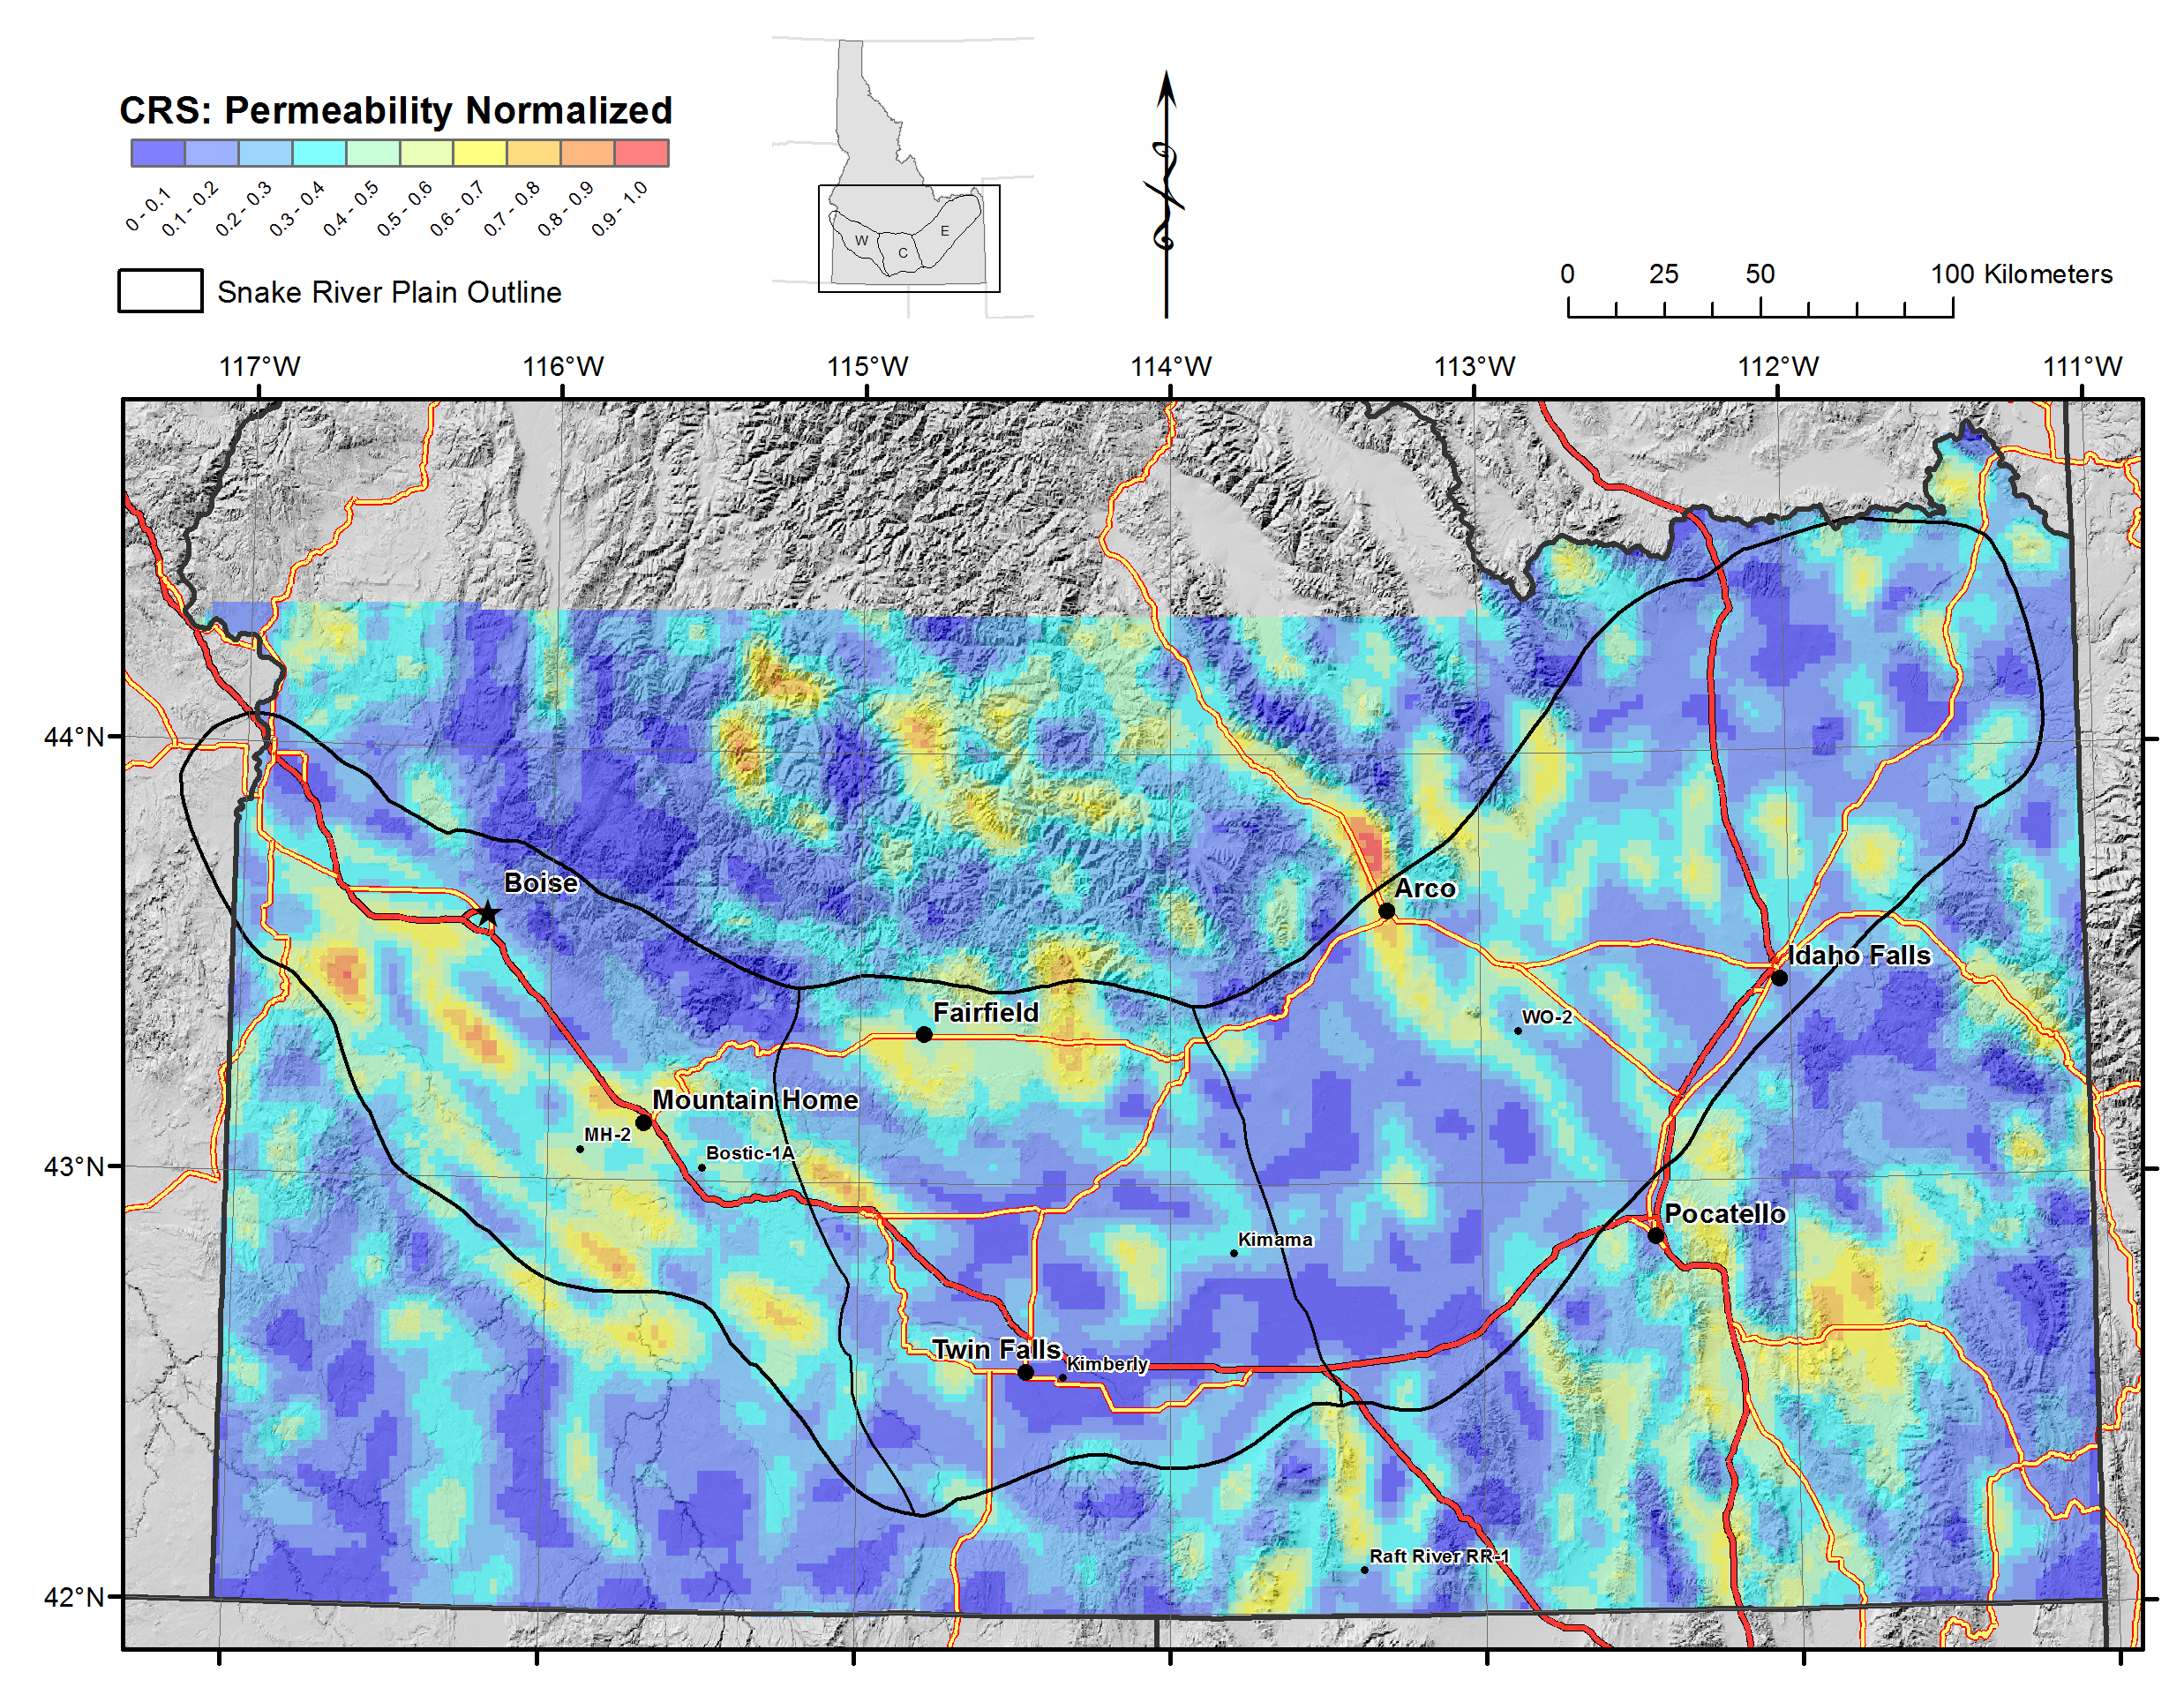
Snake River Plain Geothermal Play Fairway Analysis Heat, Permeability, and Seal CRS Map Raster Files
Snake River Plain Play Fairway Analysis - Phase 1 CRS Raster Files. This dataset contains raster files created in ArcGIS. These raster images depict Common Risk Segment (CRS) maps for HEAT,...
Search relevance: 100.64 | Views last month: 0 -
Compilation of data used to generate figures and tables in the manuscript. This dataset is associated with the following publication: Hernandez, C., L. Sharpe, C. Jackson, M. Harwell, and T....
Search relevance: 97.10 | Views last month: 0 -
Heat Stress Index, compared between historical and future time periods, including historical and percent change
Search relevance: 85.90 | Views last month: 0 -
The maps and tables presented here represent potential variability of projected climate change across the conterminous United States during three 30-year periods in this century and emphasizes the...
Search relevance: 76.63 | Views last month: 0 -
This submission includes a fault map of the Oregon Cascades and backarc, a probability map of heat flow, and a fault density probability layer. More extensive metadata can be found within each zip...
Search relevance: 72.65 | Views last month: 0 -
Geothermal well data from Southern Methodist University (SMU, 2021) and the U.S. Geological Survey (Sass et al., 2005) were used to create maps of estimated background conductive heat flow across...
Search relevance: 71.75 | Views last month: 1 -
ArcGIS Map Package with MT Station Locations, 2D Seismic Lines, Well data, Known Regional Hydrothermal Systems, Regional Historic Earthquake Seismicity, Regional Temperature Gradient Data,...
Search relevance: 69.72 | Views last month: 0 -
Tularosa Basin Play Fairway Analysis: Partial Basin and Range Heat and Zones of Critical Stress Maps
Interpolated maps of heat flow, temperature gradient, and quartz geothermometers are included as TIF files. Zones of critical stress map is also included as a TIF file. The zones are given a 5km...
Search relevance: 63.70 | Views last month: 0 -
This submission contains geospatial (GIS) data on water table gradient and depth, subcrop gravity and magnetic, propsectivity, heat flow, physiographic, boron and BHT for the Southwest New Mexico...
Search relevance: 63.49 | Views last month: 0 -
This dataset extends the development of the Renewable Energy Potential (reV) model to include geothermal energy, with a specific focus on Hawaii. Provided here are the results of two scenarios...
Search relevance: 52.41 | Views last month: 0 -
This submission contains an ESRI map package (.mpk) with an embedded geodatabase for GIS resources used or derived in the Nevada Machine Learning project, meant to accompany the final report. The...
Search relevance: 51.13 | Views last month: 0 -
This package contains a map surface that depicts the estimated spatial variation of conductive heat flow (mW/m²) in a portion of northern Nevada, the extent of the ‘Nevada Machine Learning...
Search relevance: 48.02 | Views last month: 0 -
This package contains USGS data contributions to the DOE-funded Nevada Geothermal Machine Learning Project, with the objective of developing a machine learning approach to identifying new...
Search relevance: 45.38 | Views last month: 2 -
This package contains USGS data contributions to the DOE-funded Nevada Geothermal Machine Learning Project (DE-FOA-0001956), with the objective of developing a machine learning approach to...
Search relevance: 45.26 | Views last month: 0 -
Heat Zones map the distribution of potential heat stress for plants and animals, including humans. Heat zones, defined as the number of days per year with maximum daily temperature >= 30 °C (86...
Search relevance: 45.21 | Views last month: 5 -
Heat Zones map the distribution of potential heat stress for plants and animals, including humans. Heat zones, defined as the number of days per year with maximum daily temperature >= 30 °C (86...
Search relevance: 44.38 | Views last month: 1 -
Heat Zones map the distribution of potential heat stress for plants and animals, including humans. Heat zones, defined as the number of days per year with maximum daily temperature >= 30 °C (86...
Search relevance: 44.16 | Views last month: 1 -
To show count of Post 9/11 Veterans (Living only) by County for the creation of a heat map to align with Wounded Warrior Projects’ programming.
Search relevance: 43.87 | Views last month: 3 -
Geothermics is the study of heat generated in Earth's interior and its manifestation at the surface. The NOAA National Centers for Environmental Information has a variety of publications and data...
Search relevance: 41.98 | Views last month: 0
