
Found 161 datasets matching "value of production".
-
The invention relates to a method for increasing yield in the production of polyvalent alcohols, especially trimethylolpropane, obtained by condensing formaldehyde with a higher aldehyde....
Search relevance: 63.85 | Views last month: 1 -
Continuing wetland loss in Galveston Bay, Texas (USA) has led to the development of various salt marsh restoration projects. These constructed wetlands often attempt to mimic natural marsh...
Search relevance: 49.00 | Views last month: 0 -
The West Africa Coastal Vulnerability Mapping: Commercial Crop Production, 2000 data set includes 5-minute rasters of crop production in metric tons per grid cell for five higher-value export...
Search relevance: 31.24 | Views last month: 2 -
This data set represents the average value of saturation overland flow, in percent of total streamflow, compiled for every catchment of NHDPlus for the conterminous United States. The source data...
Search relevance: 30.49 | Views last month: 0 -
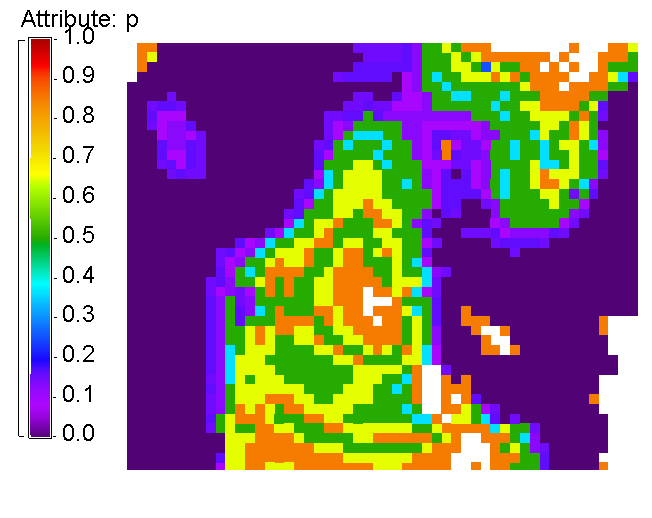
These histograms represent our calibration of conductance of a volcanic geothermal field (with a clay cap) and the observed steam flow rates. Darajat is a vapor geothermal field located in West...
Search relevance: 29.36 | Views last month: 0 -
This tabular data set represents the mean value for infiltration-excess overland flow as estimated by the watershed model TOPMODEL, compiled for every catchment of NHDPlus for the conterminous...
Search relevance: 29.32 | Views last month: 0 -
Background Nitric oxide (NO) production is increased among patients with human immunodeficiency virus (HIV) infection and also among those with tuberculosis (TB). In this study we sought...
Search relevance: 29.25 | Views last month: 0 -
This data set represents the area of bedrock geology types in square meters compiled for every catchment of NHDPlus for the conterminous United States. The source data set is the "Geology of the...
Search relevance: 28.61 | Views last month: 1 -
This data set represents the estimated amount of phosphorus and nitrogen fertilizers applied to selected crops for the year 2002, compiled for every catchment of NHDPlus for the conterminous...
Search relevance: 28.61 | Views last month: 0 -
This data set represents the average monthly maximum temperature in Celsius multiplied by 100 for 2002 compiled for every catchment of NHDPlus for the conterminous United States. The source data...
Search relevance: 28.61 | Views last month: 0 -
This tabular data set represents the mean base-flow index expressed as a percent, compiled for every catchment in NHDPlus for the conterminous United States. Base flow is the component of...
Search relevance: 28.55 | Views last month: 1 -
This data set represents the 30-year (1971-2000) average annual precipitation in millimeters multiplied by 100 compiled for every catchment of NHDPlus for the conterminous United States. The...
Search relevance: 28.55 | Views last month: 0 -
This data set represents the area of surficial geology types in square meters compiled for every catchment of NHDPlus for the conterminous United States. The source data set is the "Digital data...
Search relevance: 28.55 | Views last month: 0 -
This data set represents the estimated amount of nitrogen and phosphorus in kilograms for the year 2002, compiled for every catchment of NHDPlus for the conterminous United States. The source...
Search relevance: 28.55 | Views last month: 0 -
This data set represents the estimated area of level 3 ecological landscape regions (ecoregions), as defined by Omernik (1987), compiled for every catchment of NHDPlus for the conterminous...
Search relevance: 28.55 | Views last month: 0 -
This data set represents the 30-year (1971-2000) average annual minimum temperature in Celsius multiplied by 100 compiled for every catchment of NHDPlus for the conterminous United States. The...
Search relevance: 28.55 | Views last month: 0 -
This data set represents the average monthly minimum temperature in Celsius multiplied by 100 for 2002 compiled for every catchment of NHDPlus for the conterminous United States. The source data...
Search relevance: 28.55 | Views last month: 0 -
This data set represents the area of each level 3 nutrient ecoregion in square meters, compiled for every catchment of NHDPlus for the conterminous United States. The source data are from the...
Search relevance: 28.55 | Views last month: 0 -
This data set represents the average monthly precipitation in millimeters multiplied by 100 for 2002 compiled for every catchment of NHDPlus for the conterminous United States. The source data...
Search relevance: 28.26 | Views last month: 0
